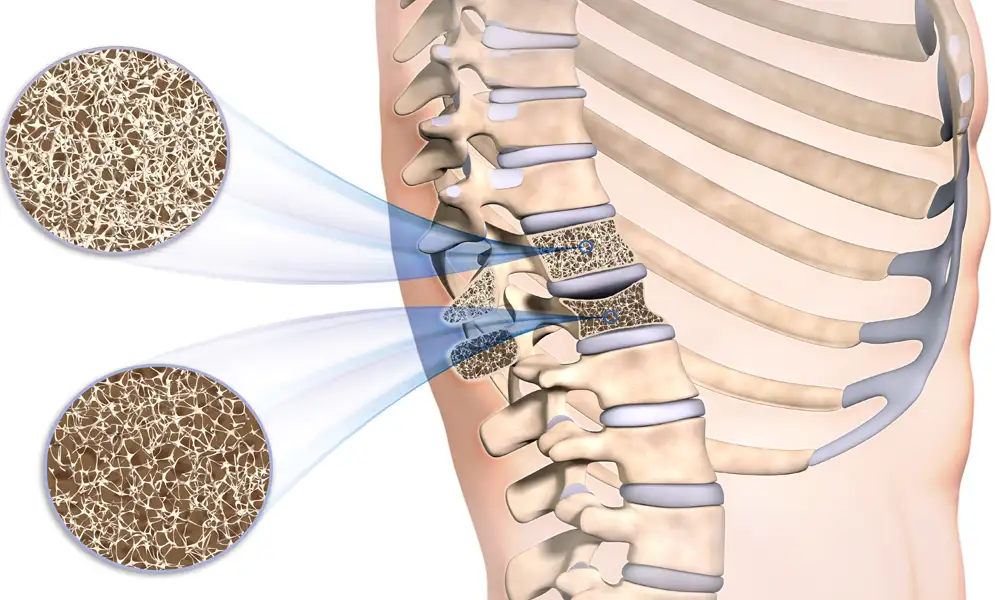
How To Interpret Bone Mineral Density Test Results
- December 24,2021
- 2 Min Read

Two scores provided by bone mineral density (BMD) studies are clinically important:
-
T-Score: The T-score is a comparison of the patient’s bone density with healthy, young individuals of the same sex.
-
Z-Score: The Z-score is a comparison with the bone density of people of the same age and sex as the patient.
WHO definitions based on BMD T-score:
Osteoporosis may be diagnosed in postmenopausal women and in men aged 50 years and older if the T-score of the lumbar spine, total hip, or femoral neck is -2.5 or less.
The following are graphic representations of bone densities (as per the T-scores), of more than 4,500 adults who got their BMD tested at Suburban Diagnostics over the past 6 years:
Important facts emerging from our study are:
-
A higher proportion of males had low bone density in the 30-39 years and 40-49 years age groups compared to females in the same age groups – 41% and 50% respectively in males versus 31% and 40% in females.
-
The vast majority of women experienced a significant drop in bone density in the postmenopausal age groups.
Please note:
-
Males are just as (if not more) susceptible as females for osteoporosis.
-
Osteoporosis can be seen even in their 30s and 40s.
-
BMD testing is essential for assessing osteopenia and osteoporosis, especially for postmenopausal women.
#unburdenhealthcare with us.
Want to book a test? Fill up the details & get a callback
Most Viewed
Premarital Health Screening
- 20 Min Read
Typhoid - Signs and Symptoms
- 3 Min Read
Home Isolation Guidelines - Covid-19 Care
- 5 Min Read
HLA B27 Detection: Flow Cytometry & PCR
- 1 Min Read


